
There’s been a small gap between posts as I’ve been looking at my rookie fantasy linebacker rankings and trying to work out if they’re actually any good. Rather than posting rankings I’m not sure about I thought I’d turn my exploration of how to project linebackers in to a series of posts and share them here.
Every IDP league is slightly different. Some reward tackles more than sacks, some sacks over tackles. What we did was try and have tackles form the meat of a linebackers points without punishing defensive lineman by having sacks and tackles for loss still give good points. The upshot of this is that, occasionally, a linebacker will put up 50 points.
But is that a bad thing?
The impact this player had on the game warranted the points allocated and so we’ve left it as is – it just makes identifying the next great linebacker all the more important.
My original rankings were based on some notes I’d made listening to podcasts, what round they were picked in and their landing spots – what this eventually turned in to is below.
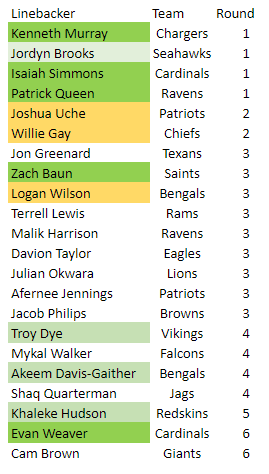
So these ‘rankings’ are ordered by round and have players highlighted depending on how I wanted to target them in the draft – gold suggesting I may reach for them, green I’d grab them early and light green might be sleepers. Pretty basic and not all that useful.
Our draft has been and gone but, with many months until the season actually starts, I may have some of rankings this year when it comes to trading… but mostly this is planning for next year.
So what would be a better way of projecting rookie linebackers? I should probably start by looking at previous classes.
The 2017 Linebacker Class

First port of call was the 2017 class. Using Sports Reference.com I transposed all of the total college career stats in to a spreadsheet and then applied our point scoring system. To make this more usable I made these stats ‘per game’ and produced a final ‘Points Per Game’ stat – the table is ordered by highest to lowest PPG. The colour code on the sheet shows highest to lowest scores per category from green to white.
Immediately this highlighted some stand out players which would allow me to then see whether there was any correlation between college production and fantasy success in the NFL.
I just needed the same data for their NFL careers… back to Pro Football Reference.com I went!

TJ Watt is at the top for PPG so I’ll assume that worked.

A quick table to calculate the difference between college production and NFL production doesn’t highlight any obvious links (other than higher picks generally do better, cheers for that insight) – time to expand the data to include the 2018 and 2019 draft classes.
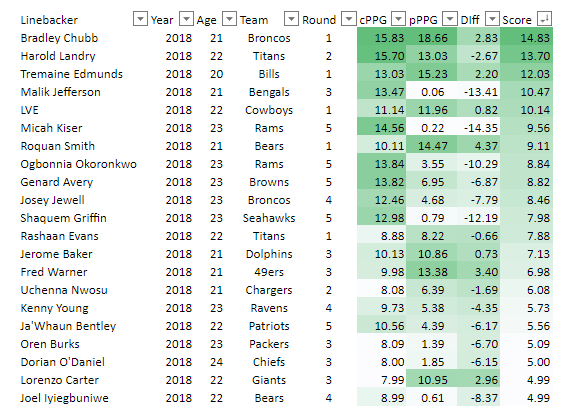
So here’s the 2018 stats with a ‘score’ column – or their college PPG minus draft round if you want more details. The ‘score’ looks to give a fairly decent projection for a player transitioning to fantasy relevance so it’s time to try this with the 2017 class. Also of note are the outliers, Malik Jefferson and Micah Kiser – I’ll look at why the college production of these players didn’t translate to the NFL later.

The 2017 ‘score’ also appears to give a decent prediction of NFL fantasy success but with a few more queries and outliers. I’ll generate the 2019 data and then come back to see what I can learn about this class.
Be right back.

Having assembled all the data I now had a chance to play around with it, and so play I did.
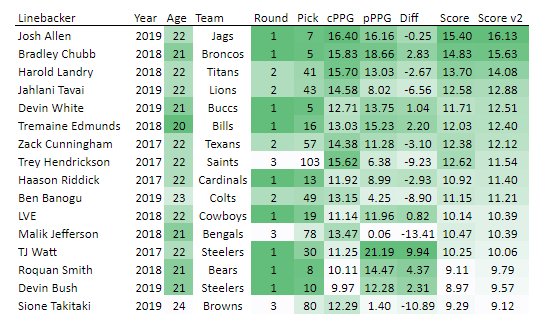
To improve the accuracy of my ‘score’ I updated all of the data to include pick number as opposed to round and then weighted this to include in a ‘score v2’. Combining the 3 year groups gave a nice top group of player with a ‘score v2’ of over 9.
At this point it as time to have a look at what caused the outliers – namely anything in the Diff column with plus or minus 5 points. A quick flick through the Sleeper app and this is what I found.
- Jahlani Tavai – a rotational role and shoulder injury hampered his first year. Possible break out candidate in 2020 if the shoulder is healthy?
- Trey Hendrickson – a defensive end rather than a linebacker, hampered by all sorts of injuries and stuck in a depth role at the Saints. Another possible breakout if he can stay healthy.
- Ben Banogu – plays more DE than LB as well, rotational role year one.. possible breakout if he can get more snaps?
- Malik Jefferson – looks to be a bust from the information available on Sleeper. Recently signed with the Chargers though so maybe he can kick start his career in LA?
- TJ Watt – late to the pass rush party having played at tight end, it took TJ a bit of time to adjust but adjust he did! He was still picked up by the model but a bit lower than you would expect
- Sione Takitaki – special teamer in his first year as he sat behind Joe Schobert on the Browns depth chart. With Schobert gone is Takitaki the heir-apparent? Break out..?
That the outliers can be explained in a reasonable manner gives me a lot of confidence in the scoring system – at worst this exercise has identified some guys on waivers I’ll be picking up!
So finally, what does this predict for the 2020 class?

So here we have the 2020 linebacker class ranked by score. 7 (+1/2 if you include Dye) linebackers from the 2020 class make the 9 point cut which, on average, would add 3 more great fantasy linebackers. Murray is the only player in this class to score over 12, a score that has seen 6 out of 7 linebackers transition their production to the NFL in the last 3 years (Tavai could well make it 7/7), making him the safest bet by these metrics.
Are these my final rankings? No. But this is a great place to start from and it draws attention to outliers that are worth checking.
- Was Troy Dye a steal for the Vikings? What about Evan Weaver for the Cards?
- Why was Patrick Queen not productive at LSU and why did the Ravens take him in the 1st?
- Was Willie Gay a reach by the Chiefs in the 2nd?
- Why was Cam Brown graded negatively?!
Tune in next time as I dive deeper into the stories behind the numbers and see if I can finally come up with a 2020 Linebacker Dynasty Ranking!
King Thrym
Head Coach of the Jotunheim Giants
@kingthrym
